Ethereum's market capitalization crossed more than half of Bitcoin and now account for nearly 17% of the total market cap. Is a dip imminent? 15 January Ethereum price prediction explains below what could be expected next.
15 January, AtoZForex - Ethereum has solidified its position as the second most traded coin next only to Bitcoin. It now accounts for nearly 17% of the total market cap. Price in recent days soared above $1400. The volume of trades in Ethereum is presently at $4.785 billion which is close to 40% of the volume of trades involving Bitcoin. Ethereum is really getting close. Despite this, price is showing some signs of bearish move as can be seen technically on ETH/BTC and ETH/USD coin pairs. If price follows this path, it could drop to $900 in the coming days.
15 January Ethereum price prediction - ETH/BTC Forecast
One of the ways to look at Ethereum and Bitcoin is to check price patterns when both are compared. The stronger or the weaker now or later can be seen on the chart using technical analysis. This will not be perfect but the clues gotten will be very useful more often than not.
 ETH/BTC price chart, H2 (click to zoom)
Price is making a double top while the MACD histogram and signal MAs are making lower highs. This is called a bearish divergence. Price is showing a minute sign of dropping. If price follows this chart pattern, Ethereum may lose some value against BTC in the coming days though the trend is still bullish. The bullish run may continue after the dip. Could this mean ETH/USD will drop? The chart below clarifies this.
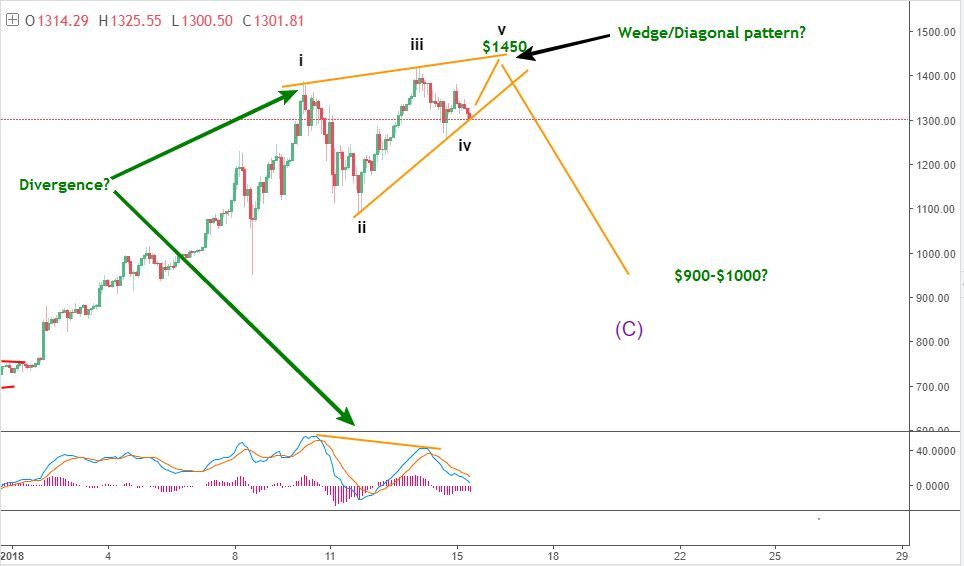
15 January Ethereum price prediction - ETH/USD Forecast
 ETH/USD price chart, H2 (click to zoom)


Same divergence is seen on ETHUSD. Price peaked at $1430 before dropping. The MACD signal MAs are getting close to the zero level. An upward crossover there could mean one more leg upside before the dip thus completing an ending diagonal pattern. Fast drops are often seen at the end of a diagonal pattern. Could this mean Ethereum will drop? Maybe, if this pattern completes and price reacts as expected. A dip to $900-$1000 is on the cards. Watch out.
Do you have other views in contrast to the ones listed or you want to compliment them further? let’s know by your comment below.
Don’t forget to share this analysis with people that matter to you.